What You Get With Our Nursing Infographic Assignment Help
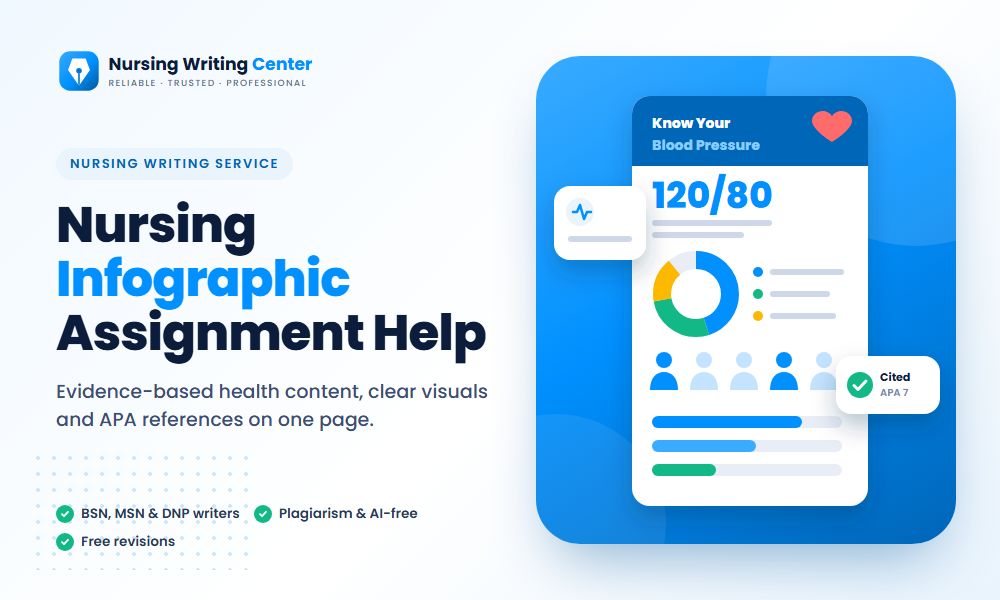
- A one-page infographic or poster in the size and tool your course requires, such as Canva, PowerPoint or Adobe Express
- Content drawn from current, credible sources, with every statistic cited
- Plain-language text written for your audience, whether patients, families, staff or policymakers
- Charts, icons and a layout that make the main message clear at a glance
- A high-resolution PDF or PNG for submission or printing, plus an editable file
- An optional written rationale, summary or reflection explaining the evidence and design choices
How We Create a Nursing Infographic
- Audience and purpose. We start with who will read it and what they should know or do afterward. A poster for new parents and a one-page summary for a hospital board need different words, data and design.
- One main message. We write the one sentence the reader should remember, and every section supports it. If a fact does not help that message, it stays out.
- Evidence from primary sources. We use agencies and guidelines such as the CDC, WHO, the US Preventive Services Task Force, AHRQ and Healthy People 2030, along with peer-reviewed research, and show the year of every figure.
- Plain-language writing. Short sentences, everyday words and clear action steps. For patient materials, we aim at or below the eighth-grade reading level that many health literacy guides recommend.
- Visual hierarchy. The headline and main message are the largest elements, followed by key numbers and steps. Icons support the words instead of replacing them.
- A quality check. We review the draft against the CDC Clear Communication Index, a research-based checklist for public health materials, and AHRQ’s Patient Education Materials Assessment Tool (PEMAT), which rates how understandable and actionable patient materials are.
Types of Nursing Infographics We Make
| Type | Audience | What it includes |
| Patient education | Patients and families | What the condition is, warning signs, self-care steps and when to call for help |
| Health promotion or prevention | Community groups | Risk factors, screening recommendations, prevention steps and local resources |
| Evidence-based practice summary | Nurses and other staff | The clinical question, key findings, strength of the evidence and the practice recommendation |
| Policy or advocacy | Policymakers and leaders | The problem in numbers, who is affected, the proposed policy and its expected impact |
| Epidemiology or data | Public health courses | Incidence and prevalence trends, disparities between groups and data sources |
Stuck on this assignment?
A nurse-writer can start in 15 minutes. Chat with us on WhatsApp or order online.
See finished examples in our samples: a safe infant sleep infographic for parents, a colorectal cancer screening infographic for a community audience and an antibiotic stewardship infographic for clinicians.
Showing Numbers People Understand
Numbers need the most care on a health infographic, because a misread statistic can change what a patient decides. Our writers follow a few rules:
- Use whole numbers and natural frequencies, such as “about 1 in 3”, instead of percentages with decimals
- Show risk with an icon array, such as 100 small figures with some highlighted, rather than a 3D pie chart
- Use the same denominator when comparing groups, so readers never have to compare “1 in 4” with “3 in 20”
- Label every chart directly and give the source and year underneath
- Never rely on color alone; add labels or patterns for readers with color vision deficiency
Infographic Mistakes That Cost Marks
- Too much text: if it reads like a paper squeezed onto one page, it is not working as an infographic
- Several competing messages and no clear headline
- Statistics with no source or year, or figures from outdated guidelines, such as a colorectal cancer screening start age of 50 after the USPSTF lowered it to 45 in 2021
- Decorative charts that do not show a real comparison
- Small fonts and pale colors that become hard to read when printed
- No clear action for the reader at the end, such as what to do, whom to call or where to learn more
Accessibility, Citations and Images
If your infographic will be posted online or on a discussion board, we add alt text that describes the key message and keep text as real text wherever the tool allows. References go in a short APA list at the bottom or on a separate reference page, depending on your rubric.
Every image and icon is either created for your infographic or comes from a library that allows reuse, so there are no copyright problems if your work is shared beyond the course.
Infographics for BSN, MSN and DNP Courses
BSN students often create patient education and health promotion infographics in community health, fundamentals and maternal-child courses. MSN courses use them for population health, health disparities, health policy and epidemiology assignments, usually with a written rationale. DNP students use infographics to share project results with staff and stakeholders, where one clear page is more likely to be read than a long report.
Send us the prompt, the rubric, your topic and your audience, and your writer will turn the evidence into a page your instructor and your audience can understand at a glance.
Sample papers
See how our writers handle this kind of paper.
- Safe Sleep for Babies: A Patient Education Infographic for New ParentsBSN
- Colorectal Cancer Screening at 45: A Community Health InfographicMSN
- Antibiotic Stewardship Infographic for Primary Care CliniciansDNP